After a great run, the Winning the Internet blog has been retired. However, you can still keep in touch with New Media Mentors here.
Anyone with a Google Analytics account can login and see how many people have visited their site, which pages the visitors checked out, where they came from, etc. That’s easy, right?
That may be easy, but it isn’t always meaningful. Sometimes, you may be interested in finding out how a subset of your audience is using your site. As long as Google Analytics is collecting the data, you can do this with Advanced Segments. Today’s post explains how to create an Advanced Segment and apply it to a report, and highlights some of my favorite Advanced Segments.
Setting up a segment
Basically, if you’ve seen something included on another report in Google Analytics, you can turn that into an Advanced Segment and use it to filter the report you’re interested in. Here’s how you do it:
1. Make a note of the dimension
The first step is to figure out what you want your segment to be. Think of it first in real world terms– ex: people that come to our site from another website – specifically Facebook. Once you’ve got that, you need to figure out what Google Analytics calls that (they use the term Dimension).
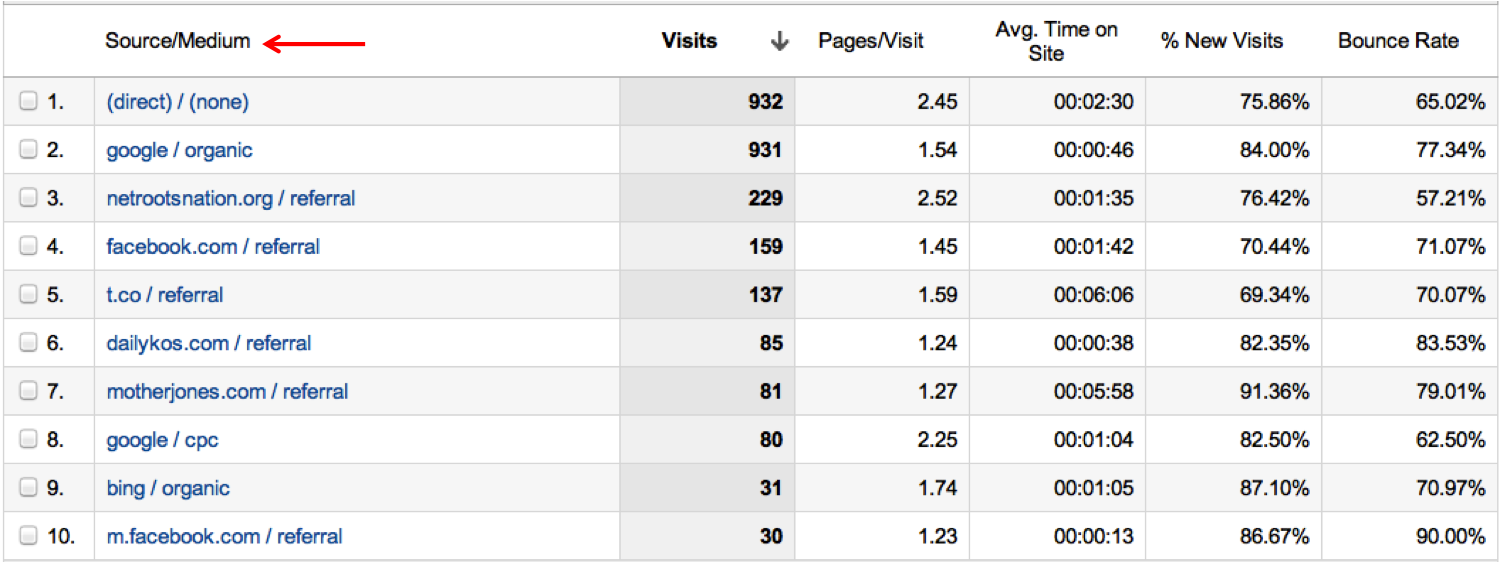
The easiest way to do this is to find a report that already has that Dimension in it, then make a note of the Dimension name, and the specific value you’re interested in. So, for the example given above, you can find the Dimension by looking at the All Traffic report (located under Traffic Sources). In this case, the Dimension is Source and the value is facebook.com or m.facebook.com. (Note: This particular report is actually using two Dimensions – Source and Medium. Either can be used to create a segment.)
2. Navigate to the report
Next, navigate to the report you’re interested in looking at for the subset of the population. For example, if you wanted to see which pages people coming from Facebook visited, you might check out the Pages report (under Content > Site Content).
3. Create and add your segment
At the top of the report, click Advanced Segments, then +New Custom Segment.

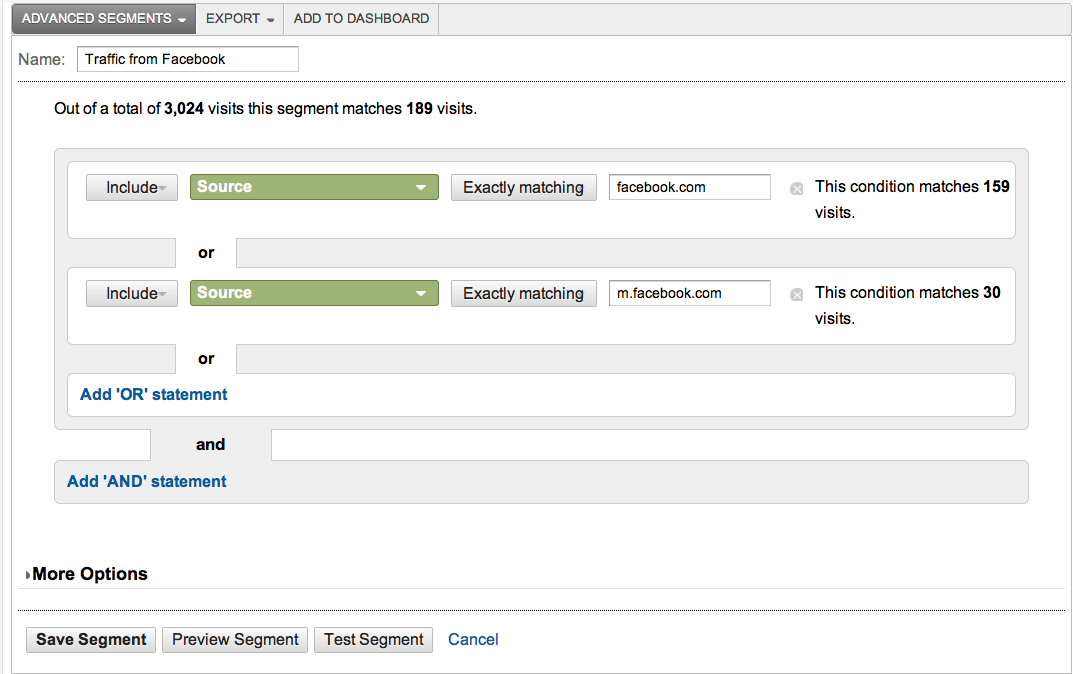
Give the advanced segment a name, then click on the green box to change the Dimension to the one you wrote down. Select the operator that is the most appropriate for your segment, then enter the value you saved before into the box next to it.
If you’re interested in more than one value for the dimension, add it under Or. When you’re done, test the segment to make sure it’s working, then click Save Segment.
There you go – you should see the report you were interested in, for that segment only. (Note: To turn off the segment, click Advanced Segments again, uncheck the box next to the segment and click Apply.)
My favorite Advanced Segments
I’ve quickly fallen in love with Advanced Segments. Once you get the hang of creating them, they’re easy to setup and are a huge help when you’re measuring results or troubleshooting issues. Here are a few of my favorites:
Traffic from social media
I like to see which of our blog posts were most popular for visitors coming from social media sites. To do this, I look at the Pages report, then follow the steps described above. I just keep adding Or statements until all of my social media sites are covered.
Location
If you’re targeting a particular state or city with your marketing efforts, it can be interesting to see how many people come to the site from that area, and how they get to the site. To do this, look at the Audience Overview report or the All Traffic report, and apply one of the following segments. Dimension = Region, containing [state name], or Dimension = City, containing [city name].
Traffic to a particular landing page
Earlier this year our blog post about the Susan G. Komen controversy received a whopping 12,000 pageviews. I wanted to find out if people that came to the site to read that post ended up checking out other pages on the site. To do this, I looked at the Pages report, then created an Advanced Segment with the following properties: Dimension = Landing Page, containing Komen.
Internet service provider
This is a really interesting one. Google Analytics records the Internet Service Providors (ISPs) of your visitors. For the most part, this information is pretty boring (the top ISPs are generally Comcast, Verizon, etc.). However, large companies and universities sometimes have their own ISPs. If for any reason you want to monitor this kind of traffic to your site, you can!
To take an initial look at the ISPs that are sending traffic to your site, check out the Network report (found under Audience > Technology). Once you’ve got a list of the ISPs you’re interested in, you can create the following segment: Dimension = Service Provider, containing [ISP]. One of the organizations I mentored recently does organizing at college campuses and went crazy for this, as it allowed them to see how their offline work resulted in traffic to their site.
If you’re new to Advanced Segments, go ahead and try creating one! They’re quick, easy and make Google Analytics soooo much more powerful.


Thanks Melissa! Although your blog post didn't exactly answer my question, it did lead me to the right direction. Advanced segments Region "Hawaii" and "Sale Goal 1 Completion". I wanted to see how many sales were coming out of Hawaii.